It’s not personal when it’s broken


At Intercom, we’re on a mission to make web and mobile business personal. Error pages, timeouts and slow responses are the opposite of this. But on those occasions when things do break it’s really important to get the customer facing communication right.
Service outages frustrate customers and prevent them from quickly completing the important jobs they set out to do. On our side, outages are stressful for the engineering teams involved, as they have to context-switch and scramble to fix whatever is broken. Outages are bad news for everyone, but the reality is that for all but trivial services, they’re inevitable. To ensure that outages are kept to a minimum, at Intercom we are building an engineering culture where performance and availability are as important as shipping fast and iteratively. This means we do things like systematically learning from our mistakes, conduct blame-free post-mortems, and design systems that expect, contain, and quickly recover from, failures.
The importance of clear communication
Dealing with service outages is hard work, but doing a great job of communicating what’s going on during an outage is really hard. External facing status updates usually take a lower priority to restoring service, and it doesn’t help that updates are tricky to get right. A badly phrased statement, use of weasel words or untimely updates erode the trust of customers. Some customers may not appreciate technical jargon, while others want to know precise details. Blaming third-party service providers is almost certainly short-sighted. Post-outage a lot of online discussion tends to focus on how cloud and SaaS services communicated with their customers, which demonstrates how much customers care about how they’re told about what’s going on.
The information customers want
When your site or service is down, customers are looking for the following pieces of information:
- Is there something broken (or is it just me)?
- Is somebody working on it?
- When will it be fixed?
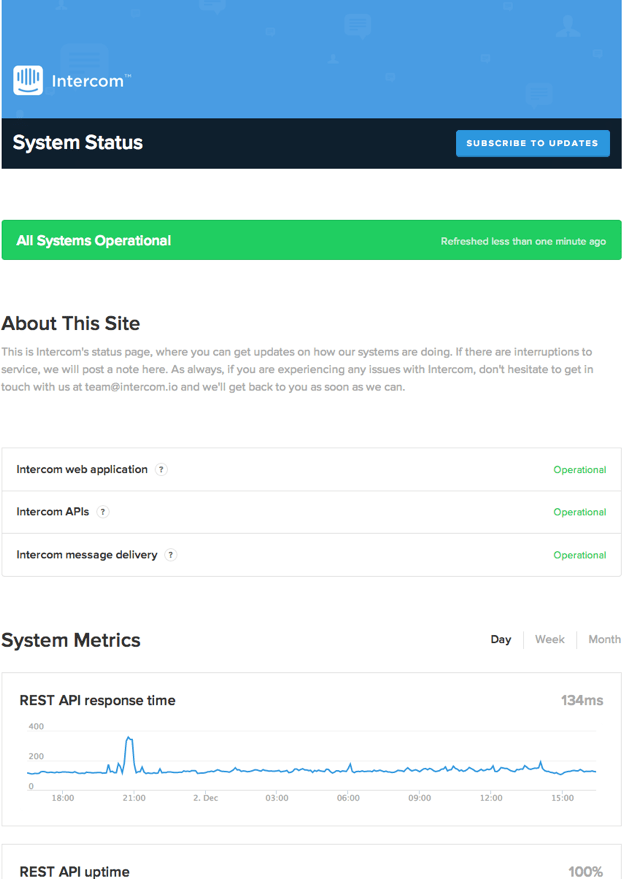
To help answer these questions, we recently set up a status page for Intercom (image above), using StatusPage.io. We’re using application performance metrics from New Relic and uptime monitoring from Pingdom to give our customers this information in real time. You will be able to quickly find out if anything is broken in Intercom right now and historically (up to a month). Additionally we will use the Intercom status page to provide updates about events, as they happen. Intercom status page updates also get synced out to our @intercomstatus Twitter account, so follow it if you want to see notifications in your feed.
The metrics currently surfaced on the status page are necessarily simple. They do not surface problems affecting a small subset of customers, or every feature of Intercom, and only provide average response times and uptimes. We intend to add further metrics such as message delivery success, so watch this space, and of course let us know if there’s something you want visibility of.
Improving Intercom’s availability
Not long after I joined Intercom earlier this year, we had a series of outages related to our main MySQL database. Intercom is largely a classic two-tier Ruby on Rails web application, and the MySQL database is a single point of failure for certain parts of the application. Our architecture is moving towards a service orientated one, but we needed to improve things quickly. We made a number of changes to our setup to recover from outages quicker and contain the blast radius of outages through tuning timeouts, pool sizes and building dedicated fleets to service traffic from different sources. We have also made some great progress on building out new services to reduce the complexity of the data store that holds customer data (while also improving response times and customer experience). Our availability metrics have improved, though we’re continuing to work on further improving our setup on multiple fronts.
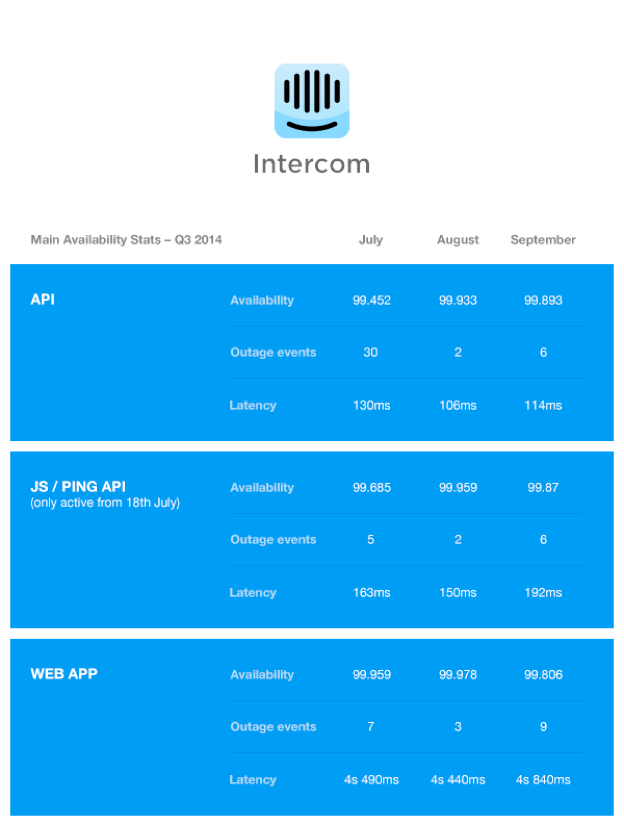
We want to share with our customers how we’ve been doing, along with some details about what’s been going on behind the scenes to improve things. Below are some numbers on how we did in Q3 2014, and some of the architecture changes we made under the hood that affected performance and availability (largely positively).
Main architecture notes for Q3 2014:
- Upgraded data-storage capacity – doubling NoSQL document store fleet, upgrading RDS MySQL instance to the largest offering.
- Tuned Ruby garbage collection to improve throughput and performance in August. (If you’re running default Ruby Garbage Collection settings with Ruby MRI 2.0, chances are you will benefit a lot from doing the same!).
- Removed queuing at the nginx/passenger layer to optimize for faster recovery.
- Tuned processes/threads/database connections to optimize for faster recovery.
- Broke out Javascript API to dedicated fleet.
- Streaming user updates to Elasticsearch increased latencies in September.
Our goal for Q4 2014 is to get availability to be better than 99.9% each month, consistently. We’re eager to get feedback about our new status page, the metrics we’re reporting publicly and how we’re communicating about outages. Let us know if there’s something we can do differently or if there’s something you’d like to see us start doing.